
How to read candlestick charts
without memorising patterns
Most candlestick guides are a list of fifty named patterns with a success rate next to each. That list is the reason people stare at a chart and see nothing they can act on.
A candle is a record of a fight over a period of time. Four readings tell you who was winning and how hard, and those four work on every candle, in every market, without a single name.
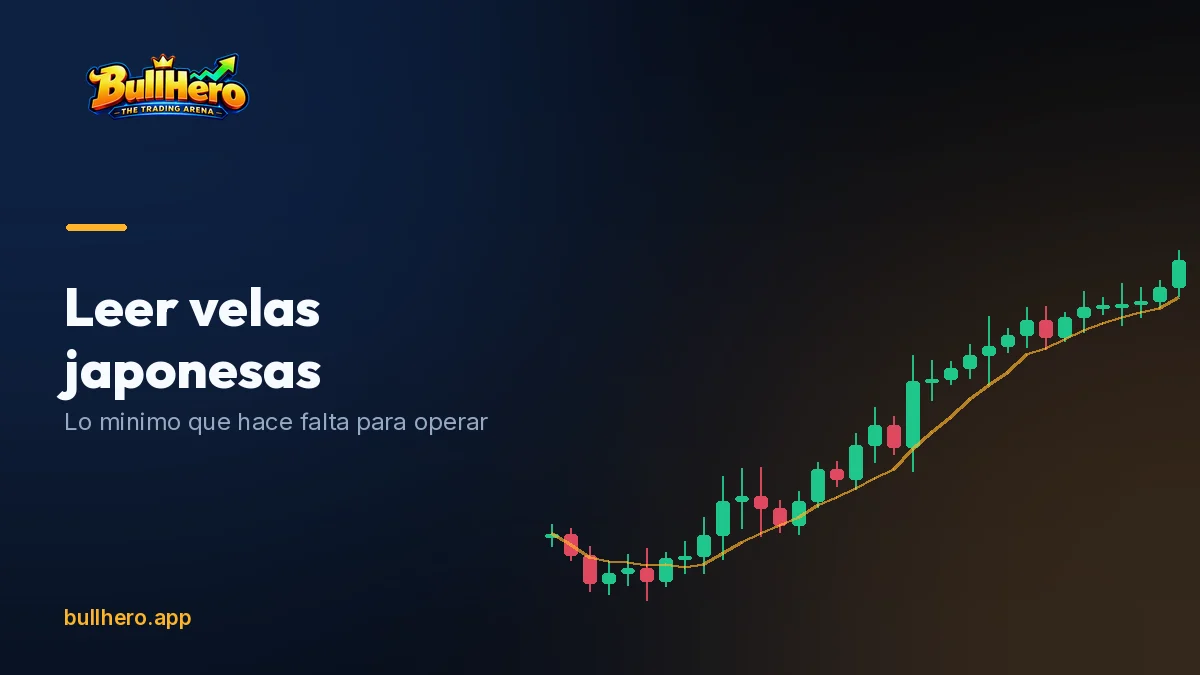
What a candle records
One candle covers a period of time you chose. On a five minute chart, each candle is five minutes of trading compressed into four numbers.
The four numbers
- Open. The first traded price of the period.
- High. The furthest price went up.
- Low. The furthest it went down.
- Close. The last traded price when the period ended.
How those become a shape
The body is the block between open and close. Green or hollow means the close was above the open, red or filled means below. The thin lines above and below, the wicks or shadows, reach to the high and the low.
Why the shape is informative
A candle is not a picture of a price. It is a picture of a disagreement resolved over a fixed window. A long body means one side won decisively. A long wick means one side pushed and got rejected. A small body with wicks on both ends means neither side got anywhere.
That is the whole vocabulary. Everything else is combinations of it, and combinations only mean something in a context, which is the part the pattern lists leave out.
Reading one: the body
The body measures conviction over the period. Not direction, which you can read from colour, but how one sided the period was.
A long body
Price opened, went one way and closed near the extreme. Whoever was on the other side kept losing ground for the whole period. On a five minute candle at the New York open, a body of thirty Nasdaq points is a statement: buyers or sellers took control and held it.
A small body
Price ended roughly where it started. This is not nothing happening. It is often a great deal happening with no resolution, which is why the wicks on a small bodied candle usually matter more than the body.
What a body cannot tell you
A big green candle is not a buy signal. It is information about the last five minutes, and the useful question is always where it happened. A big green candle into the top of a two hour range is a very different thing from the same candle breaking out of one. That location is the context, and it does most of the work.
Reading two: the wicks
Wicks are the most informative part of a candle and the part beginners ignore, because the body is bigger and more colourful.
A long wick means rejection
Price went there and came back before the period ended. Someone was willing to trade at that level and someone else was more willing to trade against it. The longer the wick relative to the body, the more decisive the rejection.
Where the wick is matters more than its length
A long lower wick at the bottom of a range, into a level that has held twice before, is a meaningful rejection. The same wick in the middle of nowhere is noise. Wicks are evidence about levels, and without a level they are evidence about nothing.
Wicks on both ends
A candle with long wicks above and below and a small body is indecision, and at the open it usually means the period was violent and unresolved. These are often the worst candles to trade off, and the best ones to wait through.
The sweep
The most useful wick to recognise: price drops below an obvious low, triggers the stops resting there, and closes back above it in the same candle. That long lower wick is a liquidity sweep, and it is a completely different event from a breakdown, even though the first two seconds look identical. The liquidity guide covers why this happens so reliably.
| Shape | What it records | What it means on its own |
|---|---|---|
| Long body, tiny wicks | One side controlled the whole period | Nothing without a location |
| Small body, long lower wick | A push down that was rejected | Meaningful only at a level |
| Small body, long upper wick | A push up that was rejected | Meaningful only at a level |
| Small body, wicks both ends | Violent and unresolved | Usually a reason to wait |
Every row ends the same way: the shape is the question, the location is the answer.
Reading three: where it closed
Of the four numbers, the close carries the most information, because it is the price both sides agreed to end the period at.
Closing near the high or the low
A candle that closes in the top fifth of its own range means buyers were in control at the moment it mattered. That is a stronger statement than the candle being green, because a green candle can close well off its high after being rejected.
Closing back inside a level
This is the single most useful close to recognise. Price broke a level during the period and closed back on the original side. The break failed. Traders who entered on the break are now offside, and their exits tend to push price the other way, which is why failed breaks often move faster than successful ones.
Closing beyond a level and staying
The opposite case: price breaks the level and the close holds beyond it. That is the difference between a sweep and a genuine break, and it usually takes a second candle to confirm. Waiting for that second candle costs you a few points of entry and saves you a large share of false breaks.
Why the close is worth waiting for
Acting mid candle means acting on a shape that has not finished forming. A candle that looks like a decisive rejection at minute three can close as a strong continuation at minute five. Beginners lose money to candles that were not finished yet.
Reading four: size against the last ten
This is the reading almost nobody is taught, and it is the one that stops the other three from producing false signals.
A candle is only big relative to recent candles
Twenty Nasdaq points at 9:31 in the morning is an ordinary candle. The same twenty points at 11:45 is an event. If you judge candle size by an absolute number, you will read the open as constant drama and late morning as constant calm, and both readings will be wrong.
Volatility comes in clusters
Large candles follow large candles and quiet follows quiet. This is one of the most consistent properties of financial time series, and it has a direct practical use: your stop has to be measured against current conditions rather than a fixed number of points. A ten point stop is roomy at midday and meaningless at the open.
The practical habit
Before reading any candle, glance at the last ten. Ask whether this one is bigger, smaller or the same. A rejection wick that is twice the size of every wick in the last ten candles is telling you something. The same wick when every candle has one is telling you the market is choppy, which is a reason to stand aside.
Where this shows up
This is also why the first fifteen minutes of the US session need different rules from the rest. The opening guide has the numbers on how much bigger the range is.
Why context beats the pattern
The uncomfortable finding about candlestick patterns is that when researchers test them mechanically on large datasets, most produce returns indistinguishable from random after costs.
What the studies actually found
Work applying candlestick rules systematically to US stock data found no consistent excess returns once trading costs were included. Later studies on other markets found the same, with occasional pockets that did not survive out of sample. That is not a claim that candles are useless. It is a claim that the pattern alone carries almost no information.
Why the pattern alone fails
A hammer is a small body with a long lower wick. That shape occurs constantly. At the bottom of a range, after a sweep of an obvious low, on the first test of a level that held this morning, it is meaningful. Twenty candles into a chop, it is noise. The mechanical test counts both, so the edge averages away.
What to replace the pattern with
Three questions, in order, before you look at the candle shape at all:
- Where are we? At a level, in the middle of a range, or in open space.
- What has price been doing? Trending, ranging, or unresolved.
- Is this candle big or small compared to the last ten?
Only then does the shape mean anything, and by that point you usually do not need the name.
The few patterns worth knowing, and why
Four are worth recognising, not as signals but as shorthand for a situation you would have read anyway.
The rejection candle
Small body, long wick on one side. Called a hammer or shooting star depending on direction. Worth recognising because it marks a level where one side tried and failed. Worthless away from a level.
The engulfing candle
A body that covers the previous candle entirely. Worth recognising because it means the period reversed everything the previous period did, which after a sequence of small candles is a change in who is in control.
The inside candle
A full candle contained within the previous one. Worth recognising because it marks compression: the range is narrowing, and narrow ranges tend to be followed by wider ones. It tells you something is coming, not which direction.
The failed break
Price closes beyond a level and the next candle closes back inside. The most useful of the four, because it identifies trapped traders and their exits are fuel. This is the one worth actually looking for.
Notice that none of these are predictions. Each is a compact description of what just happened, and the trade comes from combining it with where it happened.
How to practise this
Reading candles is a recognition skill, which means it responds to volume and feedback rather than study.
Mark levels before the session, not during
Draw the previous day high and low, the overnight range and the first fifteen minute range. Do it before you look at a single candle. Then every candle you read has a location attached to it automatically, which is the whole point.
Narrate ten candles a day out loud
Body size, wick direction, where it closed, bigger or smaller than the last ten. Out loud, because it forces the reading to be explicit rather than a feeling. Ten a day for two weeks does more than any pattern list.
Practise where you cannot rewind
Chart replay lets you scroll back and confirm, which quietly removes the difficulty. Reading a candle that is still forming, with a clock running, is the actual skill, and it needs a format where the decision stands. Paper trading has the same limitation, for the same reason.
Log what you read and what happened
Not whether the trade won. Whether your reading of the candle was correct: did the rejection hold, did the failed break run. Separating reading quality from trade outcome is how you find out which of the four readings you are actually good at.
Frequently asked questions
How do you read a candlestick chart for beginners?
Read four things on every candle: how big the body is, where the wicks are, where it closed within its own range, and whether it is bigger or smaller than the last ten candles. Then ask where it happened. The location matters more than the shape.
What do the wicks on a candlestick mean?
A wick shows price went to that level during the period and was pushed back before the close. It records a rejection. A long lower wick at an obvious low, closing back above it, is often a liquidity sweep rather than a reversal signal.
Do candlestick patterns actually work?
Tested mechanically on large datasets, most named patterns produce no consistent excess return after costs. That does not make candles useless. It means the shape alone carries little information and the context it appears in carries most of it.
What is the best timeframe for reading candles?
For intraday work, one and five minute candles for decisions and fifteen minute or hourly for context. The choice matters less than consistency: switching timeframes to find a candle that agrees with you is a well known way to lose money.
What is a bullish engulfing candle?
A candle whose body completely covers the previous candle and closes higher. It means this period reversed everything the last one did. After a sequence of small candles at a level it signals a change in control. In the middle of a choppy range it means very little.
How many candlestick patterns do I need to know?
Four: rejection, engulfing, inside and failed break. Each describes what just happened rather than predicting what comes next, and all four only mean something when combined with a level and with recent candle size.
Sources
- Marshall, Young and Rose, Candlestick technical trading strategies: Can they create value for investors? (2006).
- Horton, Stars, crows and doji: The use of candlesticks in stock selection (2009).
- Mandelbrot, The Variation of Certain Speculative Prices (1963): the origin of volatility clustering.
- CME Group, Micro E-mini Nasdaq-100 contract specs: tick size and point value.
- Nasdaq, market activity data: intraday volume distribution across the session.
Candles teach you nothing static
Three minutes, a tape that sweeps and clusters like the real open, and a decision you cannot take back. Read them while they are still forming.
Play a tournament