
Published on November 3, 2026 · 9 min read
False breakouts: how to spot a fakeout early and trade it
Price pokes above the level, your stop fills, then it turns. Why that happens, how to read a fakeout in the first candles, how to trade the failed breakout and how to stop being the liquidity.
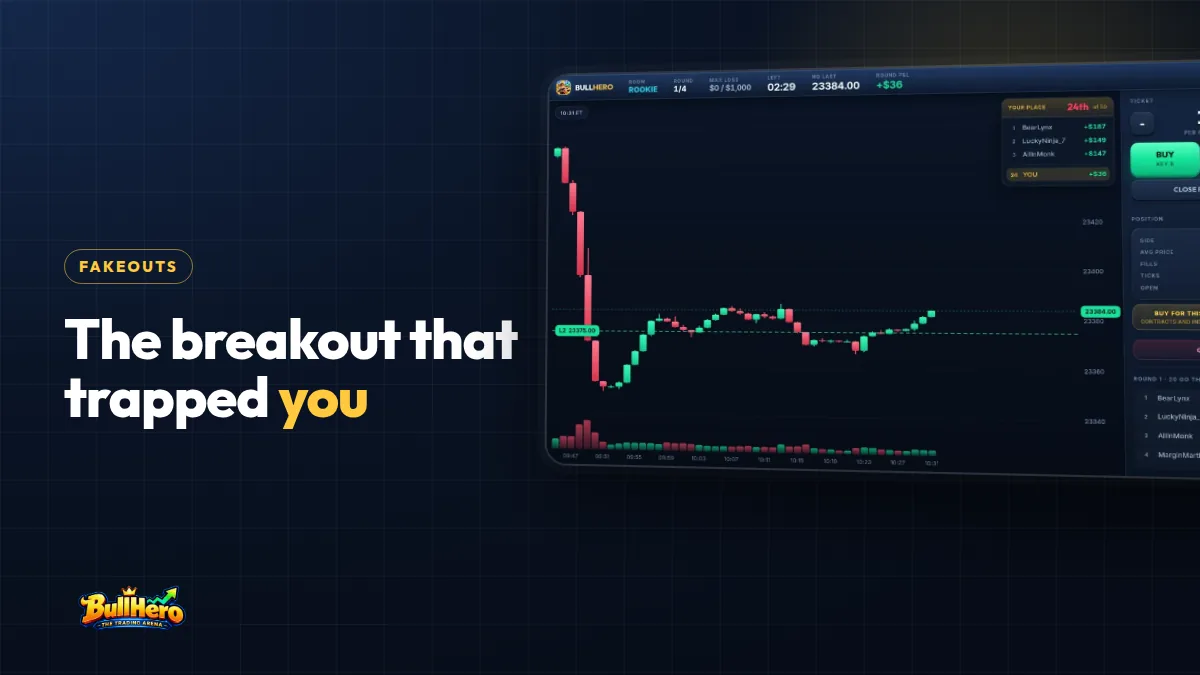
A false breakout, or fakeout, is a move beyond a support or resistance level that fails to hold: price breaks out, triggers the orders sitting past the level, then closes back inside and often reverses hard. The three signs that give it away early are a close back inside the range, weak follow-through volume and a fast rejection. You can fade it with a failed breakout entry, or avoid it by waiting for a close and a retest.
In short
- Obvious levels collect stop orders and breakout entries; filling them can be the whole move.
- The close decides: a wick beyond the level is a test, a close beyond it is a breakout candidate.
- A failed breakout trade puts the stop beyond the fakeout extreme and targets the other side of the range.
- Waiting for a retest costs some entry price and some missed moves, and saves many traps.
What is a false breakout?
Take a range on the NQ 5-minute chart between 21,540 and 21,600 that has held for an hour. A candle trades up to 21,608, eight points above the top. Breakout traders buy. Shorts who placed their stops at 21,601 are forced to buy too. Two candles later price is at 21,585, back inside, and by the end of the next half hour it is at 21,550. Everyone who bought above 21,600 is now trapped, and their exits push price further down.
That is a fakeout. The level was not "wrong": it worked exactly as a level works, as a place where many orders sit. What failed was the idea that crossing it would attract more buyers. A retest is different: price breaks out, closes outside, comes back to the level and holds it from the other side. A fakeout does not hold; it closes back inside.
Why false breakouts happen
Stops cluster above obvious levels
Equal highs, the previous day's high, the overnight high and round numbers are visible to everyone. Short sellers park their buy stops just above them; breakout traders park buy stop entries in the same place. When price reaches that zone, all those orders become market buys at once. That burst is liquidity: it lets a large seller fill a big order without pushing price down against themselves. Once the stops are consumed, the buying that drove the poke is gone. The guide on order blocks and liquidity explains this mechanism without the mysticism that usually surrounds it.
No follow-through
A real breakout needs new participants who keep buying after the level breaks. If the breakout happens on below-average volume, or at a time when nobody is trading (the lunch lull, the minutes before a data release), there is no one to carry it. Price drifts back to where the real two-way business was: inside the range.
Higher timeframe levels in the way
A break of a 5-minute range high that runs straight into the previous day's high is breaking into a wall. Before treating any breakout as real, check what sits within one or two average candle ranges beyond the level. The guide on which support and resistance levels actually matter helps you rank them.
How to identify a false breakout early
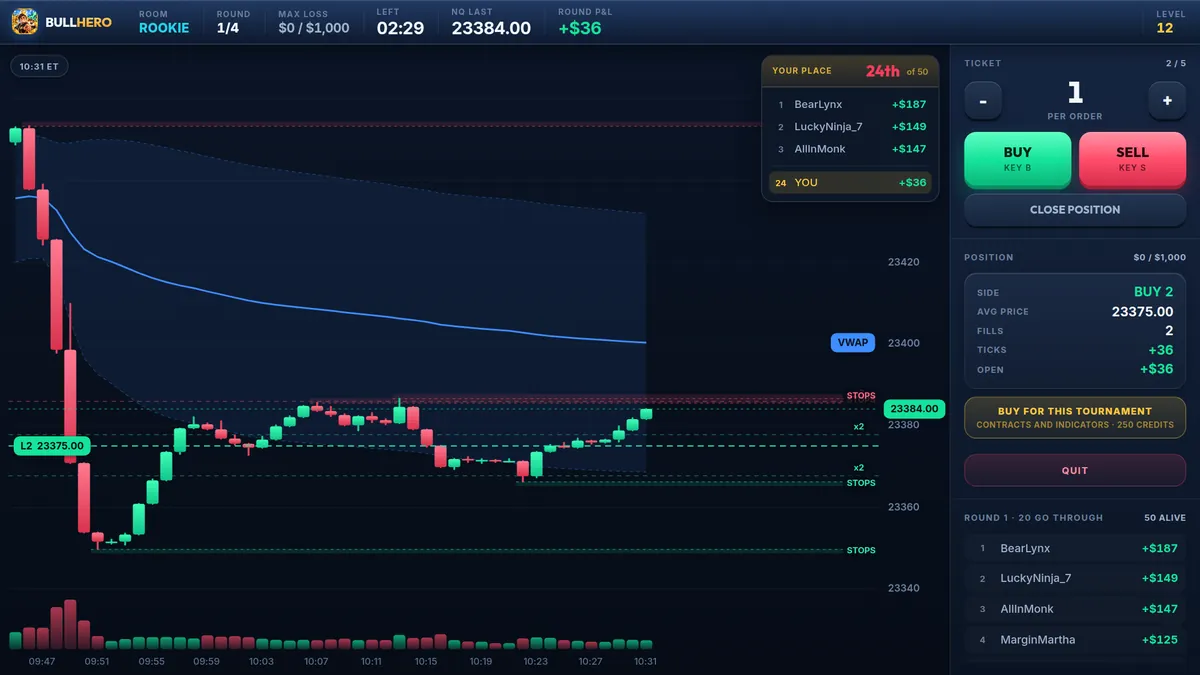
You will never know for certain while it happens. You can, however, stack the evidence. Three signals matter most:
- The close back inside. The single most important clue. A candle that trades above resistance and closes below it has told you buyers could not hold the new price. Two consecutive closes back inside are stronger still.
- Volume that does not confirm. Compare the breakout candle's volume with the average of the last 20 candles. A break on light volume is suspect. A break on very heavy volume with no progress (a long wick, small body) suggests absorption: someone sold everything the breakout buyers threw at them.
- Speed of rejection. A real breakout usually leaves the level and does not look back for a while. A fakeout returns quickly, often within one or two candles, and the move back inside is faster than the move out.
Here is how the two look side by side:
| Signal | Real breakout | Fakeout |
|---|---|---|
| Candle close | Closes clearly beyond the level, near its extreme | Closes back inside, leaving a long wick |
| Volume | Above average and sustained on the next candles | Light, or one heavy spike with no progress |
| Next 2 or 3 candles | Higher highs, shallow pullbacks | Stall, then trade back through the level |
| Retest | Holds the broken level from the other side | Slices through it back into the range |
| Context | Trend in the same direction, active session | Against the trend, quiet hour or just before data |
No single row decides. Three or more rows pointing to "fakeout" is a reasonable threshold to act on. If candle anatomy is still slow for you, the guide on reading candlestick charts without memorising patterns is the place to start.
How to trade a false breakout: the failed breakout entry
The failed breakout is the classic way to trade a fakeout: you take the side of those who will be forced out. Using the range above (21,540 to 21,600):
- Qualify the level. At least two touches of the range high and a range that has lasted long enough for stops to build, for example 45 minutes or more.
- Let the break happen. Price trades to 21,608. Do nothing yet.
- Wait for the close back inside. The candle closes at 21,595, with its low at 21,592.
- Enter on confirmation. Place a sell stop one tick below that candle's low: 21,591.75. If it does not trigger within the next two candles, cancel it.
- Stop beyond the extreme. One tick above the fakeout high: 21,608.25. Risk: 16.5 points, which is 330 dollars on one NQ (20 dollars per point) or 33 dollars on one MNQ (2 dollars per point).
- Targets. The range midpoint at 21,570 is 21.75 points away (about 1.3R); the range low at 21,540 is 51.75 points away (about 3.1R). Many traders take part at the first and move the stop to entry.
The stop above the fakeout high is not arbitrary: if price trades there again, the "failed" breakout has become a real one and your idea is wrong. More on choosing that distance in where to place a stop loss. The setup has a weakness: in a strong trend, the first close back inside is sometimes only a pause before the real break. Taking failed breakouts against a clear trend is the most common way this trade loses.
Liquidity sweeps are built into every tournament. BullHero's synthetic NQ tape includes moves where price pokes above the previous high, takes the stops and turns. Practise waiting for the close back inside before you sell, and see how often your patience pays.
Practise fakeoutsHow to avoid being trapped by a false breakout
If you trade breakouts, fakeouts are a cost of doing business. You cannot remove them, but you can stop being the easiest victim:
- Use close confirmation. Enter only after a candle closes beyond the level, never on the first tick through it. You will enter later and sometimes at a worse price, but you skip the wicks.
- Prefer the retest. Wait for price to come back to the broken level and hold it. In the example above, close confirmation alone kept you out: no 5-minute candle closed above 21,600. Had one closed above and a pullback then held 21,600, a long there with a stop at 21,588 would risk 12 points with the level on your side.
- Do not put your stop exactly on the obvious level. If your stop sits one tick past equal highs, it is part of the liquidity. Place it beyond the structure that proves you wrong, and cut size to keep the dollar risk the same.
- Respect the clock and the calendar. Breakouts in the minutes before scheduled data and during the midday lull fail more easily. Many traders simply skip them.
- Read the move, not the level. Price action behaviour (follow-through, pullback depth, candle closes) tells you more than the fact that a line was crossed.
The trade-off is real: with close confirmation and retests you will miss some clean breakouts that never look back. That is acceptable. A missed trade costs nothing; a trapped one costs a full stop.
Common mistakes with fakeouts
- Calling every wick a fakeout. A wick beyond the level that closes beyond the level is not a failure. Wait for the close back inside.
- Fading every breakout. Once traders learn about fakeouts, many start shorting every new high in an uptrend. Trends are made of breakouts that held.
- Revenge after being trapped. Getting caught in a fakeout and immediately flipping to the other side with double size is how one loss becomes three.
- Not counting. Without your own log, "breakouts always fail on this market" is a feeling. Record 50 breakouts at your levels and count how many held.
Frequently asked questions
Is a stop hunt the same as a false breakout?
They overlap. A stop hunt describes the cause: price moves to where stop orders cluster and fills them. A false breakout describes the result on the chart: a break that fails and closes back inside. Not every stop run turns into a fakeout, because sometimes the stops fuel a real breakout. Nobody has to be deliberately hunting for this to happen; clustered orders alone create the effect.
Which timeframe should I use to confirm a breakout?
Use the timeframe your levels come from, or the next one up. For an intraday NQ trader marking levels on the 5-minute chart, a 5-minute close beyond the level is the usual confirmation. A 1-minute close is too easy to fake. If your level comes from the daily chart, a single 5-minute close above it proves very little.
Are false breakouts more common than real ones?
There is no universal figure, and it depends heavily on the market, the session and how you define a level and a breakout. Breaks of very obvious intraday levels during quiet hours tend to fail often, while breaks in the direction of a strong trend hold more often. The honest answer is to log breakouts at your own levels and count.
Do fakeouts happen in forex and crypto too?
Yes. Any market where many traders watch the same levels and place stops just beyond them produces false breakouts. Thin markets and off-hours sessions, common in crypto and in some currency pairs overnight, can make the pokes longer and faster. The signals are the same: the close, the volume and the speed of the return.
BullHero is a game that uses play money and a synthetic price tape from a mathematical model; it is not a broker and does not give access to real markets. This article is for education only and is not financial advice.
Sources
- Al Brooks, Trading Price Action Trading Ranges, 2012
- Thomas N. Bulkowski, Encyclopedia of Chart Patterns, 2005
- CME Group, E-mini Nasdaq-100 Futures: Contract Specifications, 1999
More articles
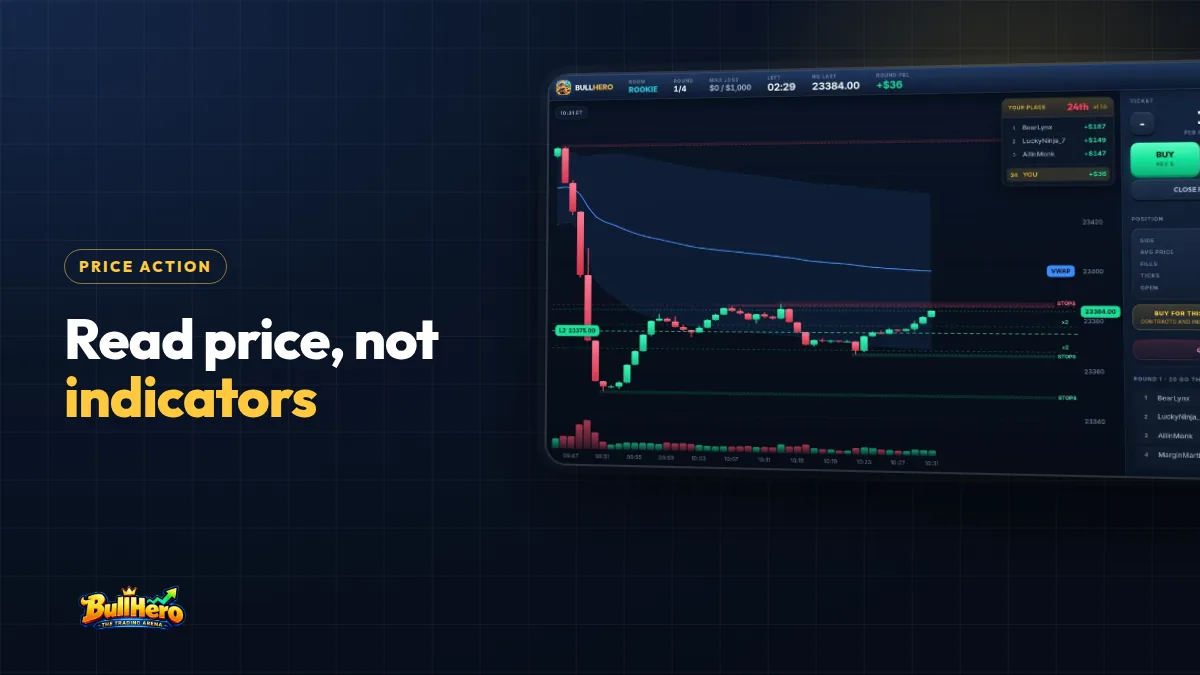
Price action trading: read the chart before the indicators do
Swing points, higher highs and higher lows, ranges, key levels and rejection candles, then three classic setups with entry, stop and target in points, how volume confirms them and how to train your eye.
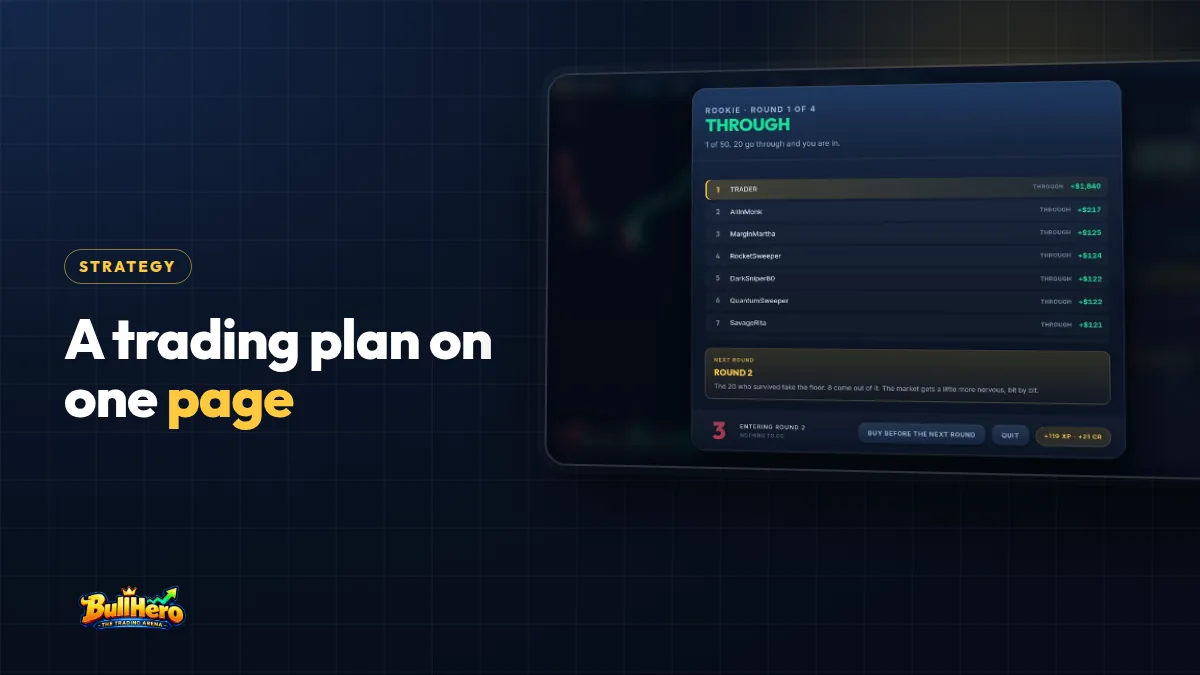
How to write a trading plan you will actually follow at 9:45 a.m.
The six sections every plan needs, a complete one-page example for an intraday NQ and MNQ trader, how to test it before real money and how many trades it takes before a rule deserves to change.
Overtrading: 6 Warning Signs, What It Costs and How to Stop It
Boredom, revenge and no plan: why traders take too many trades, what costs do to a 40-trade day compared with a 6-trade day, and the rules and journal checks that bring the count back down.