
Published on October 30, 2026 · 9 min read
Price action trading: read the chart before the indicators do
Swing points, higher highs and higher lows, ranges, key levels and rejection candles, then three classic setups with entry, stop and target in points, how volume confirms them and how to train your eye.
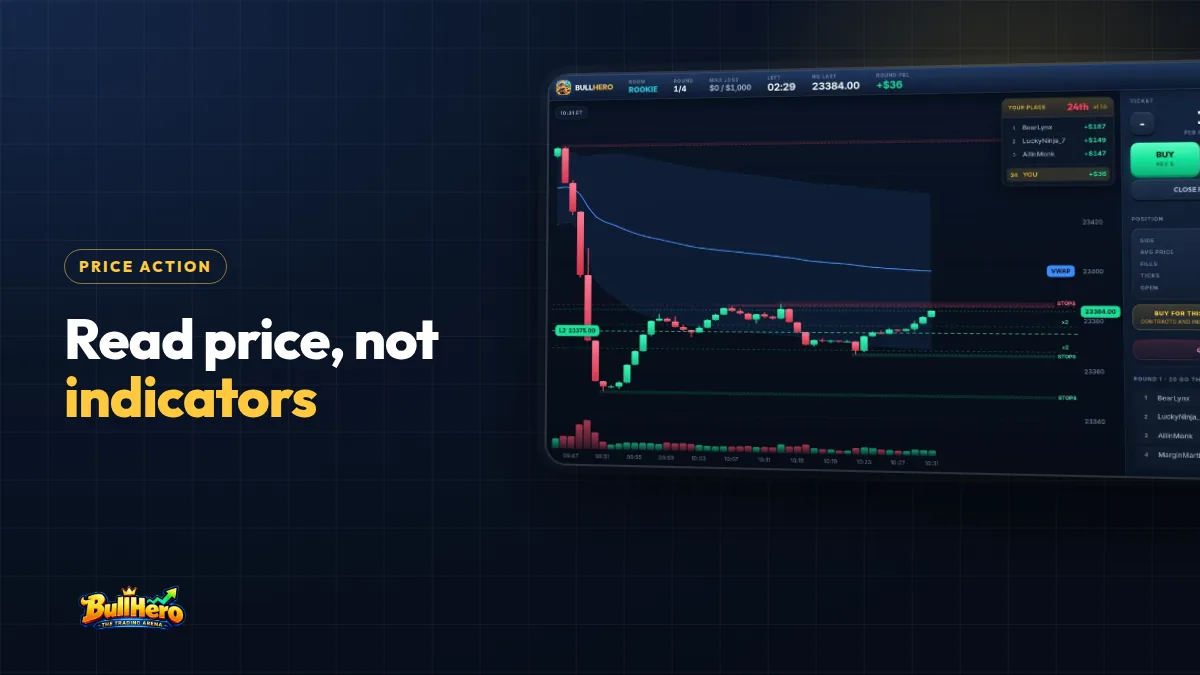
Price action trading means making decisions from the price itself: where it turned, which highs and lows it made and how candles behave at important levels, instead of waiting for a lagging indicator to confirm. You read structure (swing highs and lows, trends, ranges), mark a few key levels and act on what price does when it reaches them. This guide covers the building blocks, three setups with numbers and a drill to train your eye.
In short
- Price action is reading structure: swing points, trend or range, key levels and the reaction at those levels.
- An uptrend is a series of higher highs and higher lows. It is in question when a higher low breaks.
- Every setup needs context, a trigger, a stop at a level that proves you wrong and a target worth at least the risk.
- Pattern recognition comes from hundreds of labelled examples, not from memorising candle names.
What is price action trading?
Every indicator is a calculation made from past prices. A 20-period moving average on a 5-minute chart is the average close of the last 100 minutes; when it turns, price turned some time ago. Price action traders skip that delay and read the raw information: the open, high, low and close of each candle and where those values sit relative to the levels that matter.
That does not mean a naked chart is a religion. Many price action traders keep VWAP or volume on screen, because those tell you something price alone does not: where the average participant is positioned and how much was traded at each move. What they avoid is stacking oscillators that all repeat the same closes in different shapes.
Price action is also not pattern names. Knowing that a candle is called a "hammer" is useless without knowing where it formed. A hammer at the previous day's low after a drop is information; the same candle in the middle of a quiet range is noise. If candle anatomy is still new to you, start with how to read candlestick charts without memorising patterns.
The five building blocks of price action
1. Swing highs and swing lows
A swing high is a candle whose high is higher than the highs of the candles on each side; a common definition uses two candles on each side. A swing low is the mirror. Swing points are where buyers or sellers stopped winning, and they are the reference for everything else: trend, stops and targets.
2. Trend structure
An uptrend is a sequence of higher highs (HH) and higher lows (HL). A downtrend is lower highs (LH) and lower lows (LL). The key point is which level invalidates the trend: in an uptrend it is the last higher low. While that low holds, pullbacks are buying opportunities in context. When price closes below it, the structure is broken and you stop looking for longs until a new one forms.
3. Ranges
When highs and lows stop progressing and price bounces between two roughly equal levels, you are in a range. Inside a range, the edges matter and the middle is a coin flip. Most intraday sessions spend more time ranging than trending, which is why waiting for the edge is a skill in itself.
4. Key levels
For an intraday index futures trader, the short list is: the previous day's high, low and close, the overnight high and low, the opening range (for example the first 15 minutes after 9:30 a.m. ET) and obvious round numbers. Five or six lines are enough. The guide on which support and resistance levels actually matter explains how to tell a real level from a drawn one.
5. Candle rejection
A rejection is a candle that pushes into a level and closes well away from it, leaving a long wick. The wick shows where price was refused. The close matters more than the wick: a candle that pokes above resistance and closes back below it is a rejection; one that closes above it is a breakout.
3 price action setups, step by step
The numbers below are illustrative NQ prices. With NQ worth 20 dollars per point and MNQ 2 dollars per point, a 14.5-point stop risks 290 dollars on one NQ or 29 dollars on one MNQ.
Setup 1: pullback to a higher low in an uptrend
- Context. The 5-minute chart shows a swing low at 21,480, a high at 21,540, a higher low at 21,505 and a new high at 21,580. Structure is up.
- Location. Price pulls back to 21,540, the old high that should now act as support.
- Trigger. A candle tests 21,536, then closes at 21,548 with its high at 21,550. Place a buy stop one tick above the high: 21,550.25.
- Stop. One tick below the rejection low: 21,535.75. Risk: 14.5 points.
- Target. The high at 21,580, 29.75 points away: about 2R. If price instead closes below 21,505, the trend idea is dead.
Setup 2: range break and retest
- Context. Price has spent 45 minutes between 21,400 and 21,440, with at least two touches of each edge.
- Break. A 5-minute candle closes at 21,452, outside the range, on clearly higher volume than the candles before it.
- Retest. Do not chase. Wait for price to come back towards 21,440. It dips to 21,442 and the next candle closes up.
- Entry and stop. Buy at 21,446 with the stop at 21,431, back inside the range. Risk: 15 points.
- Target. The range height (40 points) projected from the breakout level: 21,480, which is 34 points away, about 2.3R.
Setup 3: rejection at a key level
- Context. The previous day's high is 21,620. Price rallies into it late in the morning, with the move slowing.
- Trigger. A candle trades up to 21,628, above the level, and closes at 21,614 with its low at 21,606. That is a rejection: above the level intrabar, back below it at the close.
- Entry and stop. Sell stop at 21,605.75. Stop at 21,628.25, one tick above the wick. Risk: 22.5 points.
- Target. VWAP at 21,560, 45.75 points away: about 2R.
Setup 3 trades against the recent move, so it usually wins less often than setups 1 and 2. The wick above the level is often a stop run, which the guide on order blocks and liquidity explains without the jargon. Whichever setup you use, the stop goes where the idea is proven wrong, not where the loss feels comfortable; there is more on that in where to place a stop loss.
How volume confirms price action
Price shows you what happened. Volume shows you how much conviction was behind it. A simple reference: compare each candle's volume with the average of the last 20 candles.
| What price does | Volume | Usual reading |
|---|---|---|
| Breaks a range edge | Well above average | Real participation, the break has a better chance of holding |
| Breaks a range edge | Below average | Suspect, often comes back inside |
| Pulls back in a trend | Falling | Healthy pause, trend participants are not exiting |
| Pulls back in a trend | Rising sharply | The other side is active, the higher low may fail |
| Rejects a level with a long wick | Very high | Absorption, someone large defended the level |
Volume confirms; it does not trigger. A huge volume candle in the middle of nowhere tells you little. The same candle at the previous day's high tells you the level is being fought over. Note also the time of day: volume at 9:35 a.m. is naturally far higher than at 12:30 p.m., so compare like with like.
Typical price action mistakes
- Too many lines. Twenty levels means price is always "at a level". Keep five or six and delete the rest.
- Patterns without location. A pin bar mid-range is not a setup. Location first, candle second.
- Entering before the close. A candle that looks like a rejection with 40 seconds left can close as a breakout. Wait for the close or use a stop order beyond it.
- Stops inside the noise. A 3-point stop in NQ during the open will be hit by normal movement. If the correct stop is too wide for your account, reduce size or switch to MNQ.
- Ignoring the clock. Clean structure at 10:00 a.m. often turns into chop over lunch. The same pattern does not have the same odds at every hour.
- Forgetting the maths. A setup that wins half the time needs targets larger than stops to pay for costs. Write the R multiple before entering.
How to learn price action: train your eye with repetitions
Recognising structure in real time is a perceptual skill, like reading a defence in sport. It improves with volume of examples and fast feedback, not with more theory. A drill that works:
- Build a library. For each setup, save 50 screenshots of clean examples and 50 of failures. Label context, trigger, stop and result.
- Hide the right side. In bar replay, stop at random points and answer three questions before advancing: trend or range? Where is the last swing high and low? Which key level is closest?
- Add the clock. Once you answer correctly most of the time, give yourself ten seconds per answer. Speed is what live trading demands.
- Trade the drill. Take only setups you labelled in advance, at small size or in a simulator, and log whether the label was right.
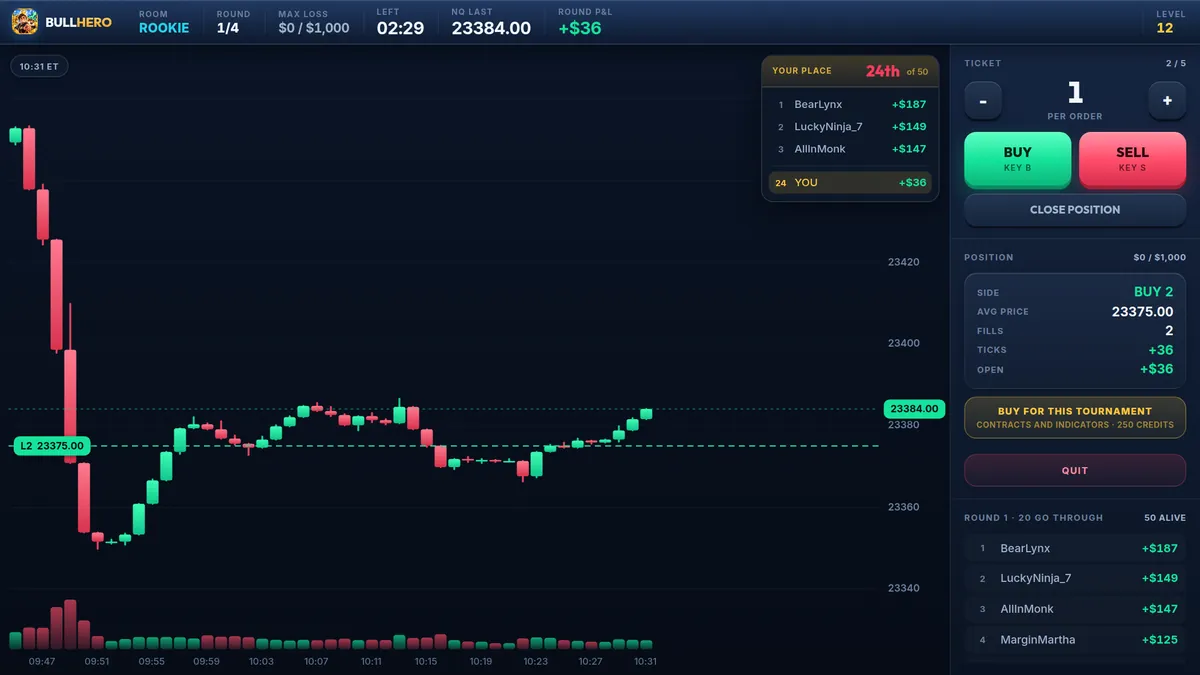
Two hundred labelled examples per setup is a reasonable first target. You will notice the change when you stop "looking for patterns" and start seeing structure before you name it.
Practise reading structure with the clock running. Each BullHero round is a new NQ-style tape of 2:30 or 3 minutes: mark the last swing high and low before every trade and only enter at a level you named first.
Train your eyeFrequently asked questions
Is price action trading profitable?
No method is profitable by itself. Price action gives you a framework to find locations with a defined risk; profit depends on the win rate and payoff of your specific setups, your costs and your discipline. Track at least 100 trades of one setup in R before drawing any conclusion, and expect long losing streaks even when the setup has a positive expectancy.
What is the best timeframe for price action trading?
For intraday index futures, many traders read structure on a 5-minute chart and mark levels on 15-minute or hourly charts. Very low timeframes, such as 15 seconds, show more noise than structure for most beginners. The best timeframe is the one where your stop fits your account at the size your plan allows, and where you can make decisions without rushing.
Can I combine price action with indicators?
Yes, as long as each tool adds information the chart does not already show. VWAP adds positioning, volume adds participation, and a level map adds context. An RSI and a stochastic on the same chart mostly repeat each other. A good test: if you removed the indicator, would you take a different trade? If not, remove it.
BullHero is a trading game with play money and a price tape generated by a mathematical model, not a broker or a real market. This article is educational and is not financial advice; prices in the examples are illustrative.
Sources
- Al Brooks, Trading Price Action Trends, 2011
- John J. Murphy, Technical Analysis of the Financial Markets, 1999
- CME Group, E-mini Nasdaq-100 Futures: Contract Specifications, 1999
More articles
False breakouts: how to spot a fakeout early and trade it
Price pokes above the level, your stop fills, then it turns. Why that happens, how to read a fakeout in the first candles, how to trade the failed breakout and how to stop being the liquidity.
How to write a trading plan you will actually follow at 9:45 a.m.
The six sections every plan needs, a complete one-page example for an intraday NQ and MNQ trader, how to test it before real money and how many trades it takes before a rule deserves to change.
Overtrading: 6 Warning Signs, What It Costs and How to Stop It
Boredom, revenge and no plan: why traders take too many trades, what costs do to a 40-trade day compared with a 6-trade day, and the rules and journal checks that bring the count back down.