
Scheduled: goes live on October 16, 2026. Only you can see it because the admin panel is open.
Published on October 16, 2026 · 9 min read
Risk Reward Ratio and Win Rate: The Maths Behind Every Trade
Expectancy with real numbers, a break-even table for every ratio from 1:0.5 to 1:4, what a tick of spread and a commission do to it, and how to read your true ratio from a journal.
The risk reward ratio compares what a trade can lose (the distance to your stop) with what it aims to make (the distance to your target). On its own it tells you very little: a 1:3 ratio still loses money if you hit the target less than 25% of the time, before costs. What decides your result is the ratio and the win rate together, called expectancy. Below: the formula, a break-even table, costs and how to measure yours.
In short
- Break-even win rate = 1 ÷ (1 + reward). 1:1 needs 50%, 1:2 needs 33.3%, 1:3 needs 25%, before costs.
- Spread and commission raise the break-even, and hurt small targets most: a 1:1 scalp with 8-tick legs needs 62.5%.
- A wider target is not automatically better. Hit rate falls and trades last longer.
- Your real ratio comes from your journal (average win ÷ average loss), not from the bracket you placed.
What is the risk reward ratio?
It is the distance to your stop compared with the distance to your target, both measured from the entry. Say you buy NQ at 21,600.00 with a stop at 21,590.00 and a target at 21,620.00:
- Risk: 10 points, 40 ticks, 200 dollars per contract.
- Reward: 20 points, 80 ticks, 400 dollars per contract.
- Ratio: 1:2. You risk one unit to make two.
That unit of risk is called R. Here 1R is 200 dollars, so the target is +2R and a stop-out is -1R. Thinking in R lets you compare trades of different sizes and instruments.
One warning on notation: some traders write the same trade as "2:1", reward first. This article always puts risk first, so 1:3 means risking one to make three. Check which way round a source writes it before you copy a rule.
The trading expectancy formula, explained with numbers
Expectancy is the average amount you make or lose per trade over many trades:
Expectancy = (win rate × average win) − (loss rate × average loss)
In R, with W as the win rate and a reward of R per winner, it becomes W × R − (1 − W). Three traders, before costs:
- Trader A: 40% wins at 1:2. 0.40 × 2 − 0.60 = +0.20R per trade. Risking 200 dollars, that is +40 dollars per trade, or +4,000 over 100 trades.
- Trader B: 60% wins at 1:0.5. 0.60 × 0.5 − 0.40 = -0.10R per trade. Right most of the time, losing overall.
- Trader C: 30% wins at 1:3. 0.30 × 3 − 0.70 = +0.20R per trade. The same expectancy as A, with a very different experience.
Trader C wins only three trades in ten. The chance of any ten trades in a row all being losers is 0.7 to the power of 10, about 2.8%. That sounds rare, but over several hundred trades a streak like that becomes likely, and most people abandon a strategy during one. For Trader A, ten losses in a row has a probability of 0.6 to the power of 10, about 0.6%. Same maths, different nerves.
Expectancy is also the input to sizing formulas such as the Kelly criterion, published in 1956. Beginners should not size from it at full strength, because their estimate of their own edge is almost always too optimistic.
Break-even win rate for each risk reward ratio
Set expectancy to zero and solve for W: break-even win rate = 1 ÷ (1 + reward). Below that win rate you lose money over time; above it you make money, before costs.
| Risk:reward | Break-even win rate | Losers you can absorb per winner |
|---|---|---|
| 1:0.5 | 66.7% | 0.5 |
| 1:1 | 50.0% | 1 |
| 1:1.5 | 40.0% | 1.5 |
| 1:2 | 33.3% | 2 |
| 1:3 | 25.0% | 3 |
| 1:4 | 20.0% | 4 |
Read the last column as the room for error. At 1:2 each winner pays for two losers; at 1:0.5 one loser wipes out two winners. Sizing is a separate decision: the ratio says nothing about how many contracts to trade, which comes from the stop and your account, as covered in risk management for beginners.
How spread and commission move the break-even point
The table assumes trading is free. It is not. Every round trip pays the spread or some slippage and a commission. Assume a total of 2 ticks per round trip on NQ: about 1 tick of spread or slippage, plus commission and fees close to one more tick (around 5 dollars, an assumption; check your broker's all-in rate). Costs make every winner 2 ticks smaller and every loser 2 ticks bigger:
- 1:2 with a 40-tick stop and an 80-tick target. Net win 78 ticks, net loss 42. Break-even: 42 ÷ (78 + 42) = 35.0%, up from 33.3%.
- 1:3 with a 16-tick stop and a 48-tick target. Net win 46, net loss 18. Break-even: 18 ÷ 64 = 28.1%, up from 25%.
- 1:1 scalp with 8 ticks each way. Net win 6, net loss 10. Break-even: 10 ÷ 16 = 62.5%, up from 50%.
The pattern is clear: costs are fixed in ticks, so the smaller the stop and target, the bigger the share costs eat. On the scalp, two ticks are a quarter of the target. That is the core of why the maths of scalping works against you: a tight scalper needs a much higher hit rate than the textbook table suggests.
Costs are also part of why the large-sample data is so harsh: in the study of Taiwanese day traders by Barber, Lee, Liu and Odean, less than 1% earned reliably positive abnormal returns net of fees. The guide on whether trading is profitable looks at what the data says.
What is the best risk reward ratio for day trading?
There is no best ratio in isolation, only the best ratio for a given setup. Pushing the target further out does three things at once:
- The hit rate falls, because price has to travel further before the stop is hit.
- Trades last longer, so they sit through more news, more noise and more temptation to close early.
- Losing streaks get longer, which is where discipline usually breaks.
Hypothetical example: the same pullback setup tested over 200 trades with three targets. At 1:1 the target is hit 58% of the time; at 1:2, 38%; at 1:3, 24%. Expectancy before costs:
- 1:1: 0.58 × 1 − 0.42 = +0.16R
- 1:2: 0.38 × 2 − 0.62 = +0.14R
- 1:3: 0.24 × 3 − 0.76 = -0.04R
The 1:3 version looks best on a social media chart and is the only one that loses. In practice, the target should sit at the next real level, where price is likely to react, and the ratio is whatever that level gives you. If the nearest level offers less than about 1:1 after costs, skip the trade instead of stretching the target.
How to measure your real risk reward ratio from a journal
The bracket you place is your planned ratio. What you actually get is different: you exit early, you slip, you move stops. Your journal gives you the real number in five steps:
- For each trade, log the initial risk (entry to original stop, times size) and the net result after costs.
- Divide result by initial risk to get the R multiple of each trade.
- Average the R of your winners and, separately, of your losers.
- Realised ratio = average win ÷ average loss. Win rate = winners ÷ all trades.
- Compare your win rate with the break-even for your realised ratio, not for your planned one.
Worked example: 60 trades, all planned at 1:2. 24 winners averaging +1.4R, 36 losers averaging -1.1R. Win rate: 40%. Realised ratio: 1.4 ÷ 1.1 = 1.27. Break-even at that ratio is 1.1 ÷ (1.4 + 1.1) = 44%. Expectancy: 0.40 × 1.4 − 0.60 × 1.1 = -0.10R. This trader planned a winning system (40% at 1:2 is +0.20R) and turned it into a losing one with two leaks: winners cut at +1.4R instead of +2R, and losers at -1.1R from slippage or moved stops. If you do not log this yet, the trading journal template has the R column ready, and the guide on where to place a stop loss deals with the second leak.
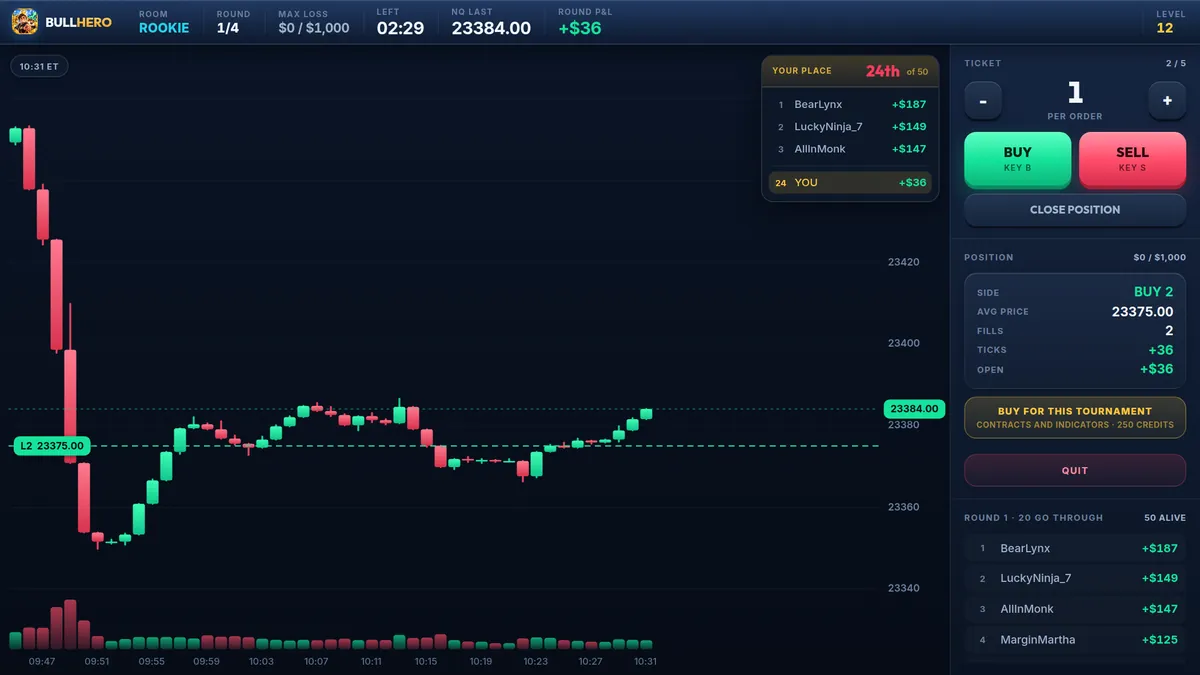
Find out what your real ratio is under pressure. In BullHero every order pays the spread and a commission, so the costs above are already in your result. Set a target before each entry, count how often you close before it, and compare your realised ratio after 20 rounds.
Measure your R:RFrequently asked questions
Is a 1:1 risk reward ratio good?
It can be, if your win rate is comfortably above 50% after costs. With 8-tick legs on NQ and 2 ticks of costs, you need about 62.5%. With 40-tick legs, the same 2 ticks lift the break-even only to about 52.5%. A 1:1 ratio works best when the stop and target are wide enough for costs to be a small share.
What win rate do I need with a 1:2 risk reward ratio?
Before costs, 33.3%: one winner of +2R pays for two losers of -1R. With a 40-tick stop and 2 ticks of costs per round trip it rises to 35.0%. Aim to be clearly above break-even over at least 50 to 100 trades before you trust the number.
Should I use the same risk reward ratio on every trade?
Not necessarily. A fixed ratio is easy to follow, but it can put targets in places where price has no reason to go. Many traders set the stop at structure and the target at the next real level, and only take the trade if the resulting ratio clears their minimum after costs.
Should the risk reward ratio include commissions?
Your planned ratio usually does not, but your realised one must. Measure results net of spread, slippage and commission, then compute the ratio from those numbers. Otherwise a strategy can look profitable on paper and lose money in practice, especially with small stops and frequent trades.
BullHero is a trading game with play money and a price tape generated by a mathematical model, not a broker. This article is for educational purposes and does not constitute financial advice.
Sources
- Kelly, A New Interpretation of Information Rate, Bell System Technical Journal, 1956
- CME Group, Micro E-mini Nasdaq-100 Futures: Contract Specifications, 2019
- Barber, Lee, Liu and Odean, The Cross-Section of Speculator Skill: Evidence from Day Trading, Journal of Financial Markets, 2014
More articles

Day Trading for Beginners: What the Job Looks Like and How to Start
One instrument, one setup, one window: a plain framework for your first year of day trading, the routine around each session, the toolkit you really need and what research on day traders shows.
Where to Place a Stop Loss: 5 Methods With Worked NQ Examples
Five ways to set a stop, worked on NQ in ticks and dollars: beyond structure, ATR multiples, session volatility, time and a hard money cap. Plus why obvious stops get swept and when moving one is allowed.
How to Keep a Trading Journal That Actually Changes Your Results
Eight fields, a template you can copy and a weekly review that hunts for one leak at a time: how to log live trades and practice rounds so your data tells you what to fix next.