
What is VWAP
and why institutions care about it
VWAP is the volume weighted average price: the average price of the session, with each price weighted by how much volume traded there.
It is the one indicator on a retail chart that large institutions genuinely use, and for a concrete reason that has nothing to do with predicting direction. Understanding that reason is what makes it useful, and explains why most retail uses of it are backwards.
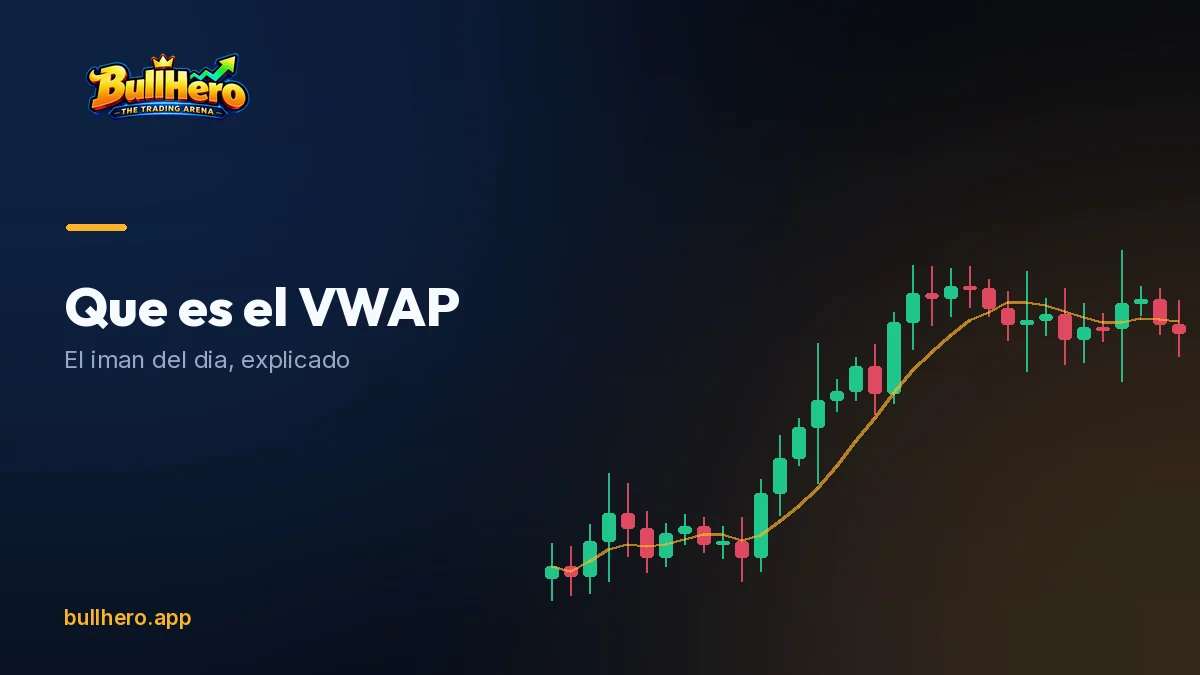
What VWAP is
A moving average of price weighted by volume, calculated from a fixed starting point, usually the session open.
How it differs from a moving average
A twenty period moving average treats every candle equally. VWAP does not: a candle where 50,000 contracts traded influences it far more than one where 2,000 did. So VWAP tracks where the money actually transacted, not where price happened to be.
Why it resets
Standard VWAP resets at the start of each session. It answers the question what is the average price paid today, which only makes sense inside one session. A VWAP that never resets converges towards a long run average and stops carrying information.
What it is not
It is not a prediction, a signal or a trend indicator. It is a measurement of where participants transacted. Everything useful about it follows from that, and everything unhelpful about it comes from treating it as a signal generator.
How it is calculated
The formula is simpler than most indicators and worth knowing, because it explains the behaviour.
The formula
For each period, take the typical price, which is high plus low plus close divided by three, and multiply it by the volume of that period. Add those products up from the session start. Divide by the total volume over the same span. That is VWAP.
What follows from the formula
- It is anchored. Every calculation runs from the session start, so the value depends on the whole session so far, not a rolling window.
- It gets heavier as the day goes on. Early in the session, few contracts are in the denominator and VWAP moves quickly. By the afternoon, the accumulated volume is large and VWAP barely moves. That is why it looks reactive at the open and almost static by 15:00.
- It cannot be calculated meaningfully without real volume, which matters in markets where volume data is fragmented or unreliable.
The practical consequence
VWAP in the first fifteen minutes is nearly meaningless, because it is an average of very little. It becomes informative once a meaningful share of the session volume is in it, typically after the first thirty minutes. The opening guide covers where that volume lands.
Why institutions are measured against it
This is the part that makes VWAP different from every other line on a retail chart, and it is an operational fact rather than a theory.
The execution problem
A fund that needs to buy two million shares cannot do it in one order without moving the price against itself. So the order is broken up and worked across the session by an execution desk or an algorithm.
The benchmark
That desk is judged on the average price it achieved versus the session VWAP. Buying below VWAP is good execution. Buying above it is bad execution that has to be explained. This is a real performance measure with real consequences for the people involved.
What that creates
A large population of participants with a mechanical incentive to buy when price is below VWAP and to be reluctant to buy above it. That is genuine, persistent order flow tied to a specific line, and it is the reason the level produces reactions at all.
The honest limit of the argument
This flow is real but it is not a force field. On a strong trend day, price can stay far above VWAP all session while buyers chase, and the desks simply report worse execution. VWAP is a reference that a subset of participants care about, not a rule the market obeys.
What the bands mean
Most platforms draw one, two or three standard deviation bands around VWAP. They are frequently misread.
What they measure
The dispersion of price around VWAP so far today. The first band contains most of the session activity, the second contains nearly all of it. They describe where price has been relative to the average, not where it ought to go.
The correct reading
Price at the second band means today has been unusually one sided relative to its own average. That is information about the character of the session. It is not a statement that price is too high.
The incorrect reading
Treating the second band as a fade signal. On a trend day price rides the upper band for hours, and every fade is a loss. The bands widen precisely when the session is trending strongly, which is exactly when fading is worst.
The useful reading
Use the bands to classify the day. Price oscillating across VWAP and reaching the first band on both sides is a balanced session where mean reversion works. Price pinned outside the first band on one side all morning is a directional session where fading VWAP is the losing trade and pullbacks to it are the opportunity.
| What you see | What it means | What it does not mean |
|---|---|---|
| Price crossing VWAP repeatedly | Balanced, two sided session | That the next cross is a signal |
| Price above VWAP all morning | Buyers in control | That it is overbought |
| Price at the second band | Unusually one sided day so far | That it will revert |
| Bands widening | Volatility rising | That a fade is safer |
Every row on the right is a trade beginners take. Every one of them is a misreading.
How to use it as a retail trader
Three uses that follow from what VWAP actually is, rather than from treating it as a signal.
As a bias filter
Price above VWAP means the average buyer today is in profit. Price below means the average seller is. That single reading is a reasonable default bias: look for longs above, shorts below, and be more sceptical of trades against it. It filters rather than triggers.
As a level where flow exists
Because execution desks are benchmarked on it, a pullback to VWAP in a trending session is a place where genuine buy interest tends to appear. That makes it a reasonable location to look for a continuation entry, with the same requirement as any level: wait for a reaction, not a touch.
As a session classifier
Ten seconds at 10:30 looking at where price sits relative to VWAP and the first band tells you whether today rewards fading or following. That decision matters more than any individual entry, and most losing days come from applying range tactics to a trend day.
What not to do with it
Do not use a VWAP cross as an entry trigger on its own. Price crosses it constantly in a balanced session, and in a trend it crosses once and never again. In both cases the cross by itself is not evidence.
The three ways it gets misused
These come up constantly and each one has the same root: treating a measurement as a prediction.
Fading the bands on a trend day
The most expensive of the three. The bands widen when the session is directional, which makes the fade look more attractive exactly when it is most dangerous. If price has not crossed VWAP since 10:00, the day is telling you what it is.
Using it in the first ten minutes
With almost no volume in the calculation, VWAP sits wherever the first few candles were and moves erratically. Decisions based on it at 9:33 are based on an average of nothing.
Using it on a weekly or monthly chart
The institutional benchmarking that makes VWAP meaningful is a daily execution measure. Nobody is benchmarked against a monthly VWAP, so the flow that creates the reaction does not exist. The line still draws, but the reason for it to matter has gone.
The pattern behind all three
VWAP works, to the extent it works, because specific people have a specific reason to transact around it. Any use that removes those people removes the effect. That test resolves most questions about whether a given application makes sense.
Anchored VWAP
A variation worth knowing, because it addresses a real limitation of the standard version.
What it is
The same calculation, but started from a point you choose rather than from the session open. Common anchors are a major high, a major low, an earnings release or a macro announcement.
Why it can be better
It answers a more specific question: what is the average price paid by everyone who has traded since that event. If a session gapped on news, the average price since the news is more relevant than the average including the pre news drift.
The risk that comes with it
You choose the anchor, which means you can choose the anchor that supports your idea. Standard VWAP has no such freedom, and that constraint is part of its value. Anyone with six anchored VWAPs on a chart has built the same problem as having fifteen levels drawn.
Using it sensibly
One anchor, chosen before you have a position, at an event any participant would recognise. If you cannot name why other people would care about that anchor, it is a line only you can see.
Where it stops working
Four conditions under which VWAP carries little or no information, and recognising them saves more than using it well does.
Thin sessions
Overnight, holidays and half days have too little volume for the average to reflect meaningful participation. The line is drawn from noise.
Markets without centralised volume
In spot forex there is no consolidated volume figure, so any VWAP is based on a partial feed from one venue. The calculation runs and the meaning does not survive.
Strong trend days
Price can remain outside the first band for an entire session. VWAP still tells you the bias correctly, which is useful, but it offers no entries, and waiting for a pullback to it means missing the day.
Immediately after a scheduled release
A macro print causes a volume spike at a price far from the existing average. VWAP jumps, the bands widen, and for the following minutes the reading is distorted by a single event. Wait for it to stabilise before using it.
The common thread is that VWAP is a measurement of participation. Where participation is thin, unmeasurable or one sided, the measurement stops being informative, and no amount of tuning fixes that.
Frequently asked questions
What is VWAP in trading?
The volume weighted average price: the average price of the session with each price weighted by the volume that traded there. Unlike a moving average, it reflects where the money actually transacted rather than where price happened to be.
How is VWAP calculated?
For each period, multiply the typical price, which is high plus low plus close divided by three, by that period volume. Sum those products from the session start and divide by the total volume over the same span.
Why do institutions use VWAP?
Execution desks working large orders across a session are benchmarked against the session VWAP. Buying below it is good execution, buying above it has to be explained. That creates a real population of participants with a mechanical reason to transact around the line.
What do the VWAP bands mean?
They show the dispersion of price around VWAP so far today. Reaching the second band means the session has been unusually one sided relative to its own average. It is a description of the day, not a signal that price will revert.
Can you use VWAP for swing trading?
Standard VWAP resets daily, so it is an intraday tool. Anchored VWAP from a significant high, low or news event can work over longer horizons, but the institutional benchmarking that gives the daily version its meaning does not apply.
Is VWAP better than a moving average?
They answer different questions. A moving average smooths price over a window. VWAP measures the average price paid, weighted by volume, from a fixed anchor. For intraday work VWAP carries information a moving average does not, because large participants are measured against it.
Sources
- Berkowitz, Logue and Noser, The Total Cost of Transactions on the NYSE (1988): execution cost benchmarking.
- Madhavan, Market Microstructure: A Survey: how large orders are worked across a session.
- Admati and Pfleiderer, A Theory of Intraday Patterns (1988): the intraday volume curve.
- CME Group, market data: consolidated futures volume, which spot forex lacks.
- Nasdaq, market activity data: volume distribution through the session.
A measurement, used as one
Three minute rounds with real volume behind the tape. Practise classifying the session before you decide how to trade it.
Play a tournament