
Published on November 10, 2026 · 8 min read
Best trading indicators: what each one is good for, and its trap
Eight indicators every trader meets, what each one measures, where it helps and how it misleads, a comparison table by type and a simple method to cut your chart down to two or three tools.
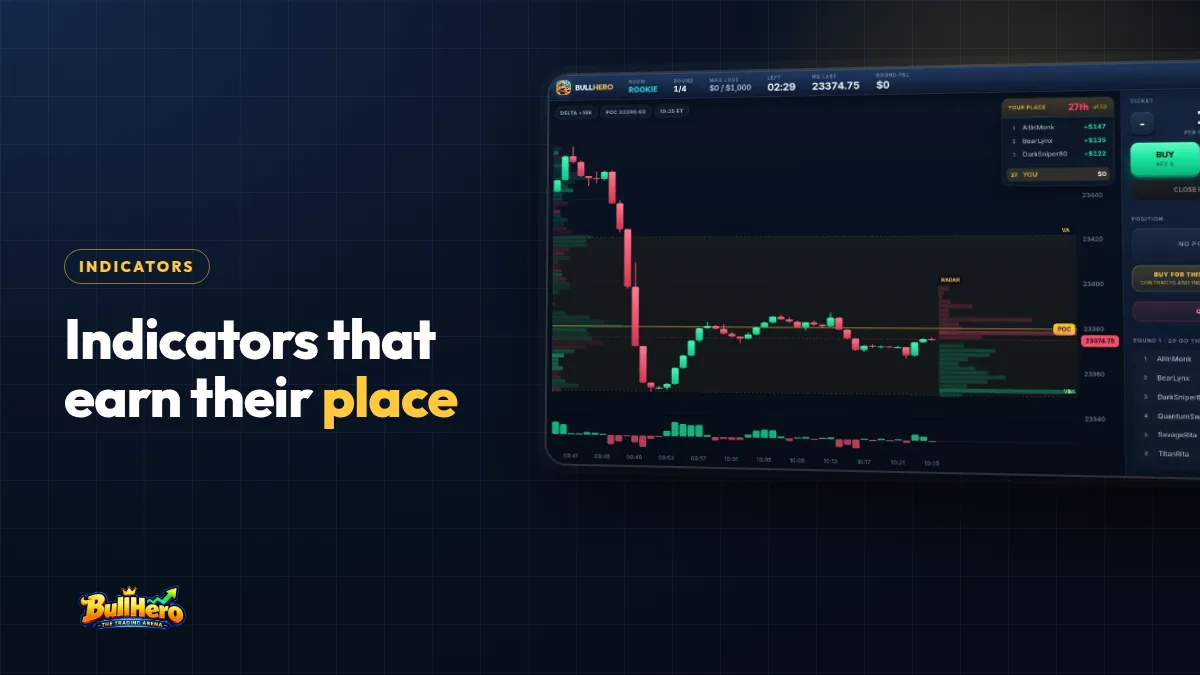
The best trading indicators are the ones that add information the candles do not already show: VWAP for where the average participant is positioned, volume and volume profile for participation, ATR for how far price normally moves, and well-chosen support and resistance levels. Moving averages, RSI, MACD and Bollinger Bands can help, but they mostly reshape the same closing prices. Use two or three tools that measure different things, and know each one's trap.
In short
- Almost every indicator is a calculation from the same open, high, low, close and volume. Different shapes, same inputs.
- Pick one tool per job: trend, momentum, volatility, volume. Two or three in total is plenty.
- Every classic indicator has a classic trap, usually lag in trends or false signals in ranges.
- Test an indicator by removing it: if your trades do not change, it was decoration.
What makes a trading indicator useful?
An indicator is a formula applied to price and volume. Most fall into four families: trend (which way and how strongly), momentum (how fast price is moving compared with recent bars), volatility (how far it moves) and volume (how much is traded and where). Support and resistance is not a formula, but it does the most important job: telling you where to act.
The common mistake is stacking tools from the same family. RSI, the stochastic oscillator and MACD are all built from closing prices and all measure momentum. Three of them on one chart give you one opinion three times, and the false confidence that comes with it. A useful indicator either uses an input the others ignore (volume, time) or answers a different question.
The eight indicators worth knowing, one by one
Moving averages
Measures: the average close of the last N bars; the exponential version (EMA) weights recent bars more. Good for: a trend filter, for example only looking for longs while a 5-minute chart holds above its 20 EMA. Trap: crossovers arrive late. In a range, price crosses the average back and forth and every crossover is a small loss.
VWAP
Measures: the volume-weighted average price since the session opened: the sum of price × volume divided by total volume. Good for: intraday bias (above VWAP, buyers are in control on average), a benchmark large funds use to judge their own executions, and a mean to which stretched moves often return. Bands at one and two standard deviations show how far price has stretched. The guide on what VWAP is and why institutions care goes deeper. Trap: it resets every session, so at 9:35 a.m. it rests on a few minutes of data and means little.
RSI
Measures: the Relative Strength Index, introduced by J. Welles Wilder in 1978, compares average gains with average losses, usually over 14 bars, on a 0 to 100 scale. Good for: spotting stretched moves inside ranges and momentum divergences. Trap: in a strong trend RSI can stay above 70 for hours. Selling "overbought" in an uptrend is one of the most expensive beginner habits.
MACD
Measures: the gap between a 12-period and a 26-period EMA, with a 9-period EMA of that gap as the signal line. Gerald Appel developed it in the late 1970s. Good for: spotting momentum turns on higher timeframes. Trap: it is an average of a difference of averages, so it lags twice. On a 1-minute or 5-minute chart, the crossover often prints after most of the move is over.
Bollinger Bands
Measures: a 20-period moving average with bands two standard deviations above and below, developed by John Bollinger in the 1980s. Good for: seeing volatility compress (bands narrowing, often before an expansion) and judging whether a move is stretched. Trap: a touch of the upper band is not a sell signal. In trends price "walks the band" for a long time.
ATR
Measures: the Average True Range, also from Wilder, is the average size of recent bars including gaps. Good for: stop distance and position size, alongside the structure-based rules in where to place a stop loss. If the 5-minute ATR on NQ is 12 points, a stop at 1.5 ATR is 18 points: 360 dollars on one NQ (20 dollars per point) or 36 dollars on one MNQ (2 dollars per point). Trap: it has no direction. It tells you how far, never which way.
Volume and volume profile
Measures: volume per bar, and in the profile, volume traded at each price over a period. The price with the most volume is the point of control (POC); the band holding about 70% of the volume is the value area. Good for: confirming breakouts and finding prices the market accepted or rejected. Trap: spot forex has no central exchange, so "volume" there is usually a count of price changes at one broker. On futures such as NQ the volume is the exchange's, which is a real advantage.
Support and resistance
Measures: prices where the market turned before: previous day's high and low, overnight range, swing points. Good for: deciding where to enter, where the stop goes and where to take profit. Trap: drawing twenty lines, so price is always "at a level". The guide on which levels matter and which are drawn noise shows how to keep only the real ones.
Trading indicators compared: type, best use and trap
| Indicator | Type | Best use | Classic trap |
|---|---|---|---|
| Moving averages | Trend | Trend filter, direction bias | Late crossovers, whipsaws in ranges |
| VWAP and bands | Volume, trend | Intraday bias and mean reversion | Meaningless in the first minutes of the session |
| RSI | Momentum | Stretched moves inside ranges | Fading "overbought" in a trend |
| MACD | Momentum, trend | Momentum turns on higher timeframes | Double lag on short charts |
| Bollinger Bands | Volatility | Squeezes before expansion | Treating a band touch as a reversal |
| ATR | Volatility | Stop distance and position size | Reading it as direction |
| Volume and profile | Volume | Breakout confirmation, POC and value area | Tick volume passed off as real volume |
| Support and resistance | Levels | Where to enter, stop and target | Too many lines |
A pattern stands out: the tools that use something other than closing prices (volume, the session's start, the size of bars) are the ones that add most beside a plain candlestick chart. That is why many intraday futures traders end up with levels, VWAP and volume, and little else.
How many indicators should I use?
Two or three, from different families. More than that and the indicators start disagreeing, which hands your decision to whichever one agrees with what you already wanted to do. Some combinations that do not overlap:
- Intraday index futures: key levels, VWAP with bands, volume profile of the prior session.
- Swing trading stocks: 50-day moving average as a trend filter, ATR for stops, levels from the daily chart.
- Range trading: levels, RSI for stretch at the edges, volume to spot the break that ends the range.
To cut down a crowded chart:
- Write one line per indicator: what decision does it change?
- Group them by family using the table above.
- Keep at most one per family, and at most three in total.
- Remove one more for 20 trades. If your entries and exits do not change, delete it for good.
If you find you can make decisions from structure and levels alone, read the price action trading guide: many traders end up there after years of adding indicators.
How indicators work in BullHero
BullHero lets you draw seven indicators on its NQ-style chart: support and resistance, order blocks, liquidity zones, VWAP and bands, flow and delta, market depth (a volume profile with POC, value area and absorption walls) and an order radar. The radar shows resting orders the game places near levels that price has respected; they do not come from a real order book. The liquidity zones mark where stops cluster, which links directly to order blocks and liquidity.
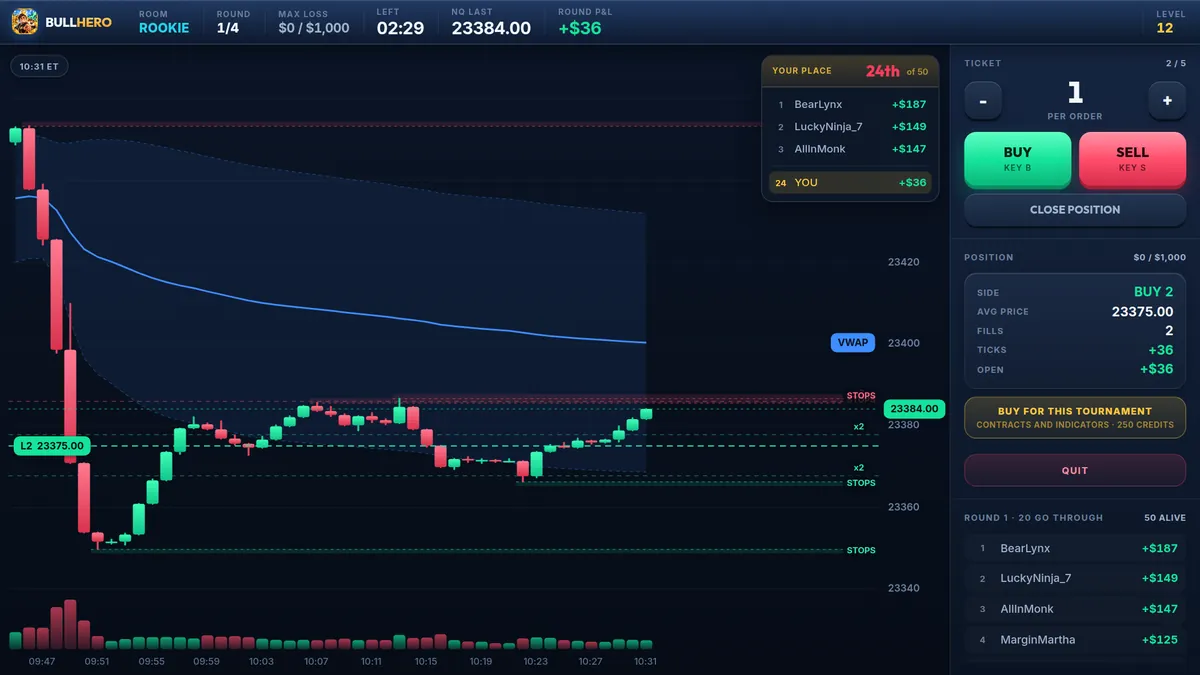
Each indicator is consumed per tournament and paid with credits, which you earn by playing or can buy. That turns the 2 to 3 rule into a real choice: you pick the tools you think will change your decisions, and the score tells you whether they did.
Choose three indicators and play a tournament with only those. Then play one with just levels. Comparing your results on the same kind of NQ-style tape is the fastest way to learn which tools change your decisions and which only decorate the chart.
Test your indicatorsFrequently asked questions
What is the most accurate trading indicator?
None. Accuracy depends on the market, the timeframe and how you use the tool, and any indicator that worked reliably on its own would be arbitraged away. Claims of a "90% accurate indicator" are marketing. Judge an indicator by whether it improves your results over at least 100 trades in your own journal, measured in R, compared with the same setup without it.
Which indicators do day traders use most?
For index futures, VWAP, volume, volume profile and key levels from the prior session are extremely common, because they reflect where business was done. Moving averages are widely used as trend filters. Oscillators such as RSI are popular with beginners but used more selectively by experienced intraday traders, mostly inside ranges. Use what fits your setups rather than what is popular.
Are paid indicators better than free ones?
Rarely. Most paid indicators combine the same inputs as the free ones (price, volume, time) with different settings and colours. Before paying, ask what the tool measures that your current chart does not. If the seller cannot explain the calculation, or shows only winning screenshots, keep your money and test the free version of the idea first.
BullHero is a trading game: play money, prices generated by a mathematical model and no access to real markets, since it is not a broker. This article is for education and is not financial advice.
Sources
- J. Welles Wilder Jr., New Concepts in Technical Trading Systems, 1978
- John Bollinger, Bollinger on Bollinger Bands, 2001
- Gerald Appel, Technical Analysis: Power Tools for Active Investors, 2005
- J. Peter Steidlmayer and Kevin Koy, Markets and Market Logic, 1986
More articles
FOMO in trading: why you chase candles and 7 rules that stop it
The classic late entry, taken apart with real maths: how loss aversion, social proof and recent wins push you into a move that has already happened, and seven practical rules that break the habit.
Micro futures for beginners: MNQ and MES in real numbers
What the Micro E-mini Nasdaq-100 and S&P 500 are worth per point and per tick, when they trade, why they make proper sizing possible on a small account and where their costs bite.
Leverage in trading: what it really does to your account
One NQ contract controls hundreds of thousands of dollars of index. What that means for a 1% move, how margin and margin calls work, why losses grow as fast as gains and how to let your stop set the size.