
Published on October 6, 2026 · 9 min read
How to Keep a Trading Journal That Actually Changes Your Results
Eight fields, a template you can copy and a weekly review that hunts for one leak at a time: how to log live trades and practice rounds so your data tells you what to fix next.
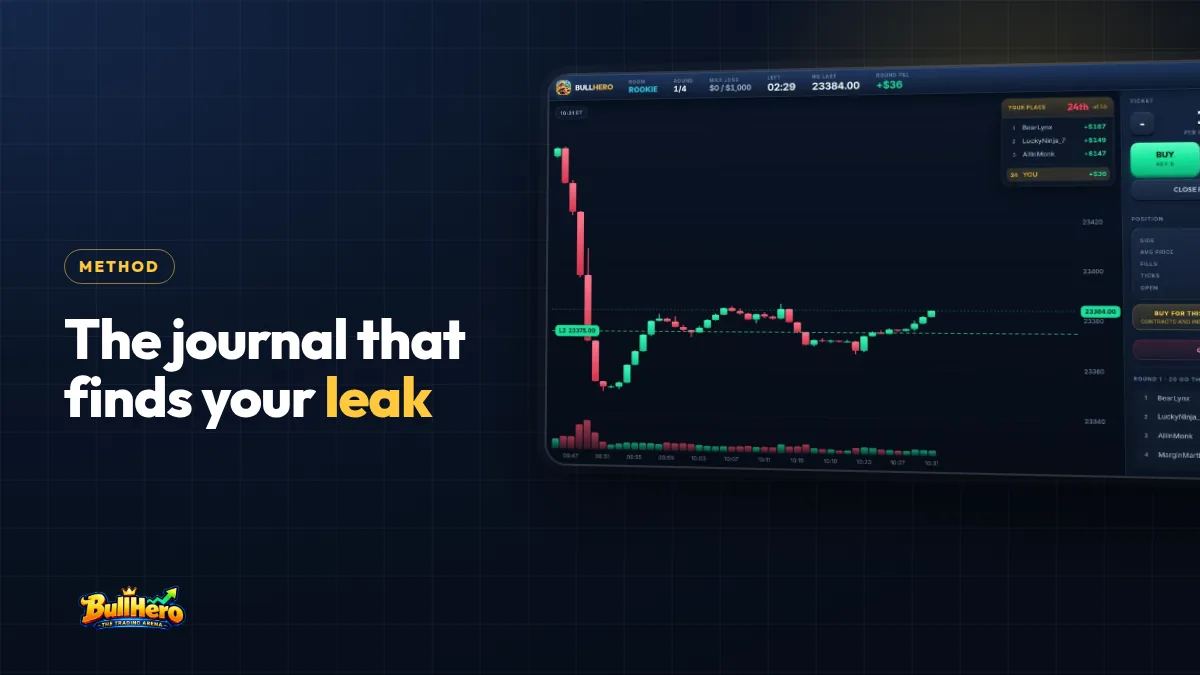
A trading journal is a record of every trade with its reason, its risk and its result, written so you can find patterns later. To keep one that changes your results, log the same eight fields on every trade, attach a screenshot, and once a week hunt for the single leak that costs you most. This guide gives you the fields, a template to copy, the weekly review routine and the mistakes that make most journals useless.
In short
- Log decisions, not just profit: setup, reason, stop, size, R multiple, emotion, rule broken and a screenshot.
- Write the entry reason before you know the outcome, or hindsight will rewrite it for you.
- Review once a week and fix one leak only, measured with one number.
- Practice counts: every tournament round is a data point if you log it the same way.
Why most trading journals change nothing
Most traders who "keep a journal" keep a profit diary: date, instrument, plus or minus. Your broker statement already does that, and it has never improved anyone's trading. Profit alone cannot tell you whether a loss was a good trade that failed or a bad trade you should never have taken.
A useful journal links a decision to its result, so you can change the decision. That means recording what you saw and why you clicked, at the moment you clicked. Psychologists have shown since the 1970s that once people know an outcome, they remember their earlier reasoning as if they had expected it. Write the reason after the exit and a lucky trade becomes "I knew it", while a good loss becomes "I should have seen it". The guide on why traders fail with real money but not in demo covers why that gap widens once your own cash is at stake.
What should you write in a trading journal?
Eight fields per trade, no more. Each one exists because it answers a question in the weekly review.
- Setup. The name of the pattern from your own short list, for example "opening range break" or "VWAP pullback". Three setups at most. If you cannot name the setup, that is information too: write "none".
- Entry reason. One sentence, written before or at the click: "Long above the 9:45 high, volume rising, stop under the pullback low."
- Stop. The price and the distance in ticks.
- Size. Contracts and the money at risk if the stop is hit.
- R multiple. Net result divided by the initial risk. A trade that risked 200 dollars and made 300 is +1.5R; one that lost the full 200 is -1R.
- Emotion, 1 to 5. 1 = calm and following the plan, 3 = impatient or eager, 5 = angry, rushing or trying to win back a loss. Define the scale once and keep it.
- Rule broken, yes or no. If yes, which rule: moved the stop, entered without a setup, sized up after a loss.
- Screenshot. One at entry, one at exit, with your stop and target visible.
A worked example on NQ
You buy 1 NQ at 21,640.00 with a stop at 21,630.00. That is 10 points, or 40 ticks, and 10 × 20 = 200 dollars at risk. You exit at 21,655.00 for +15 points, which is 300 dollars gross. Take off costs, say one 4-dollar commission and a tick of slippage on the exit (5 dollars), and you net 291 dollars. The R multiple is 291 ÷ 200 = +1.46R. Always log R net of costs: it is the only figure that stays comparable when you change size or instrument.
R is also why the "size" field matters. If you do not yet size from the stop, start with the guide to risk management for beginners, because a journal full of random sizes produces random R values.
Trading journal template you can copy
Copy these rows into a spreadsheet as columns, in this order, and add one line per trade. The middle column is the NQ trade above, filled in.
| Field | Example entry | Rule for filling it |
|---|---|---|
| Date, time, instrument | 8 Oct, 9:52, NQ | Always the same time zone, e.g. New York |
| Setup | Opening range break | Only names from your list, or "none" |
| Entry reason | Long above 9:45 high, stop under pullback | One sentence, before the outcome |
| Entry and stop | 21,640.00 / 21,630.00 (40 ticks) | Stop as placed, not as moved |
| Size and risk | 1 contract, 200 dollars | Risk if the original stop is hit |
| Result in R | +1.46R (291 dollars net) | Net of commission and slippage |
| Emotion (1 to 5) | 2 | Peak during the trade, not after |
| Rule broken | No | If yes, name the rule |
| Screenshots | entry.png, exit.png | Stop and target visible |
Paper, spreadsheet or a dedicated journaling app all work. A spreadsheet is the best place to start because filters and averages are one click away. Paid apps that import your fills save typing at high volume, but no import can fill in the reason, the emotion or the rule broken. Those three columns are the journal; the rest is bookkeeping.
Keep each entry under two minutes. A journal that takes ten minutes per trade gets abandoned in the second week.
The weekly review: how to find the one leak
Daily reviews tend to be emotional and short-sighted. Once a week, with at least 15 to 20 trades in the sheet, run the same five steps in about 20 minutes:
- Filter the week and write the total in R at the top.
- Split by rule broken. Sum R for "no" and for "yes" separately.
- Split by setup. Which setup made money and which one only felt good?
- Check emotion against result. Average R for trades rated 1 or 2 versus trades rated 4 or 5.
- Pick one leak and write one rule for next week, with a number you can check.
Here is how it looks with real numbers. Say the week had 23 trades and ended at -1.3R. Split by the rule column:
- 17 trades, rule kept: +6.2R in total, an average of +0.36R per trade.
- 6 trades, rule broken: -7.5R in total, an average of -1.25R per trade.
The strategy was fine. Six trades, a quarter of the week, wiped out everything and more. If five of those six show emotion 4 or 5 and came within ten minutes of a loss, the leak is not your setup, it is what you do after a losing trade. Next week's rule writes itself: "After a loss, no new trade for five minutes. Target: zero trades rated 5." One leak, one rule, one number. Fixing three things at once makes it impossible to know which change worked.
How to journal practice sessions and tournament rounds
Practice data is still data. The skill you are measuring, following your own rules under pressure, is the same in a simulator and in a live account. What changes is how you log it, because practice is fast and dense.
In a BullHero tournament, each round lasts two and a half or three minutes and the whole event takes about eleven. Logging every click would take longer than playing. Log per round instead, as one row:
- Room and round number (for example ROOKIE, round 2 of 4).
- Number of trades and number of rule breaks.
- Result in play money and as a share of the room's maximum loss (ROOKIE allows 1,000 dollars per round).
- Peak emotion, 1 to 5, and whether you qualified.
Four rounds give you up to four rows per tournament. Ten tournaments a week give you 10 to 40 rows, more than enough for the same weekly review. Keep practice and live trades on separate tabs and compare one figure across both: the percentage of rounds or trades with no rule broken. If it is 90% in practice and 60% live, the problem is pressure, not knowledge.
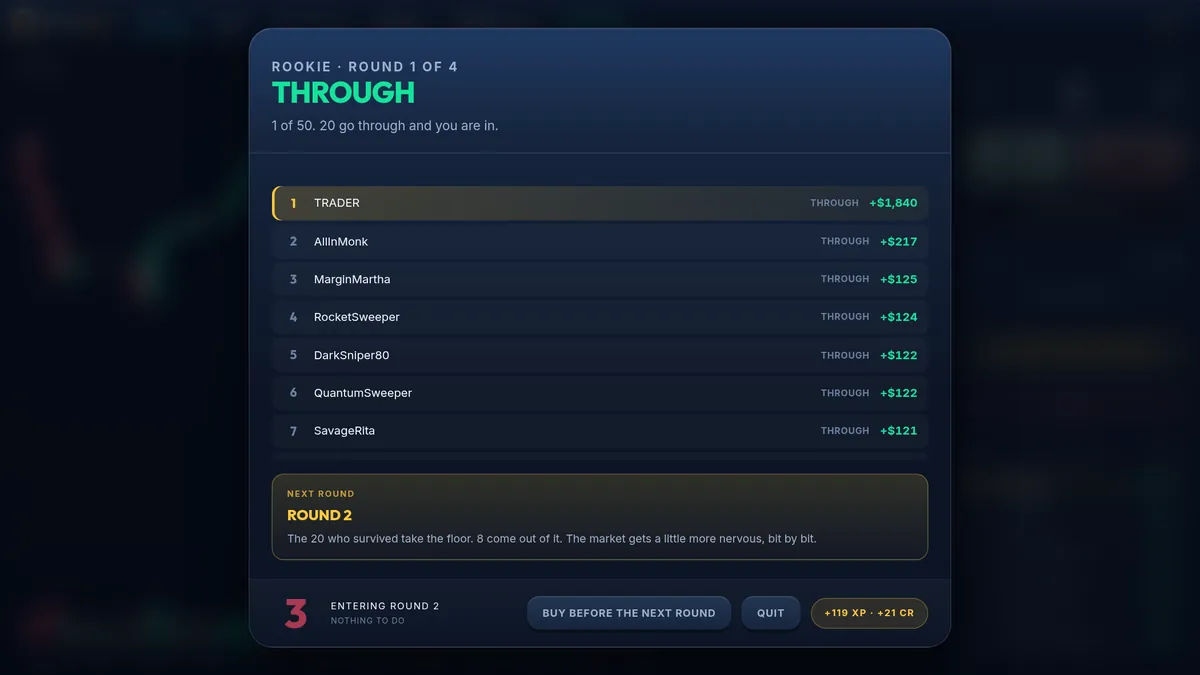
If you are still choosing where to practise, the comparison of the best apps to learn trading shows which types give you a history you can journal.
Ten tournaments can give you up to 40 rows of honest data. Play a few rounds in BullHero this week, log each one with the fields above, and run the five-step review on Sunday. Everyone in your slot trades the same candles, so you can also compare your rounds with theirs.
Play a tournamentCommon trading journal mistakes
- Logging dollars instead of R. A 400-dollar win on 2 contracts and a 200-dollar win on 1 can be the same trade. Only R lets you compare them.
- Writing the reason after the exit. You will record the story that fits the result.
- Thirty columns. Fields you never use in the review are friction. Eight is enough; add one only when a review question needs it.
- Skipping the screenshots. Three weeks later you will not remember what the chart looked like, and the screenshot is what shows you entered in the middle of a range.
- Journaling only the losers, or only the good days. A partial sample gives a wrong answer.
- Changing several rules at once. One leak per week is slower and works better.
A journal also tells you where you are in the learning curve. If you are not sure what to practise first, the guide on learning trading from scratch in the right order gives you the sequence.
Frequently asked questions
How long should a trading journal entry take?
Under two minutes per trade, plus about 20 minutes for the weekly review. Fill in the setup, reason, stop and size when you enter, and the result, emotion and rule broken when you exit. If an entry takes longer than that, you have too many fields, and you will probably stop journaling within a couple of weeks.
Should I keep a trading journal for a demo account?
Yes. A demo journal shows whether you follow your rules when nothing is at stake, which is the baseline. If your rule-kept percentage is low in demo, it will be lower with real money. Keep demo and live entries on separate tabs so the comparison stays clean and you can see the gap between the two.
How many trades do I need before a journal tells me anything?
Around 20 trades per setup gives a rough first read, and 50 to 100 per setup is far more reliable. Behaviour leaks, such as trading right after a loss, show up much sooner because they repeat. Judge your rules weekly and your strategy only once you have a large sample.
Do I need a paid trading journal app?
No. A spreadsheet with the eight fields is enough for most beginners. Paid journals help when you trade often, because they import fills and draw charts automatically. They cannot fill in why you entered, how you felt or which rule you broke, and those columns are what make a journal useful.
BullHero is a game with play money and prices produced by a mathematical model; it is not a broker and does not connect to real markets. This article is educational and is not financial advice.
Sources
- Fischhoff, Hindsight ≠ Foresight: The Effect of Outcome Knowledge on Judgment Under Uncertainty, Journal of Experimental Psychology: Human Perception and Performance, 1975
- Kahneman, Thinking, Fast and Slow, 2011
- CME Group, Micro E-mini Nasdaq-100 Futures: Contract Specifications, 2019
More articles
Best Apps to Learn Trading: What Each Type Trains and How to Pair Them
Broker demos, charting apps with paper trading, courses, flashcards and tournament games: what each kind of app really teaches, which two to combine and a four-week plan you can run on your phone.

The Best Trading Simulator Games to Learn Trading Without Risking Money
Broker demos, bar replay, portfolio contests, prop firm exams and short tournaments: what each one actually trains and what none of them can. Plus a practice routine that turns screen time into skill.